We Americans have a lot of November traditions. Thanksgiving. Black Friday. Cyber Monday. Playing Christmas music waaaaay too early. Voting. And a new one over the past few decades, complaining about polls.
In case you have been living under a rock, we in the United States had an election last week. It was a close race to the end, but former Donald Trump ended up winning pretty easily after flipping several states that voted against him in 2020. A lot of people were expecting Harris to win, or at least to have performed better. Which raises the question, how accurate were the polls?
To answer that I looked at swing state polls aggregated by 538. I only looked at polls more recent that October 15th and from the states Georgia, Michigan, North Carolina, Pennsylvania, and Wisconsin, as those are states where we have lots of polls from being projected swing states. Arizona and Nevada also had a number of polls, but as of November 11th they still have a significant number of ballots to count so I was less confident in their results. I also only looked at likely voter polls and head to head matchups between Harris and Trump (sorry Jill and Chase, but neither of you were real candidates).
Here is a histogram of the polling errors (positive values are errors in favor of Trump, negative values in favor of Harris).

Clearly there was a bias against Trump in the polls. And some were off by a lot. In fact one poll was off by over 6 points. That poll turns out to be the Susquehanna Polling & Research Michigan poll from October 29th showing Harris up by 5.1 percentage points, a state Trump ended up winning by 1.4 percentage points. So clearly critics of polls have a reason to be upset, right?
Well, not quite. You also have to take in account the margin of error. That particular poll had a margin of error of 4.9%. Naively you may think that a 4.9% margin of error would mean a 5.1% advantage to Harris safely into her column, but that’s misunderstanding what the margin of error means. The reported margin of error is usually the 95% confidence level of a particular response.
The reported margin of error is usually the 95% confidence interval of a particular question. But when the poll’s results are reported, they are often reported as the difference between the two candidate’s result. But both of those responses are highly correlated (if candidate A is up by 2%, candidate B is probably down by 2%). So the error is being double counted. Meaning the margin of error for that spread is actually going to be a 9.8 percentage points.
What happens when we scale the results with the margins of error?
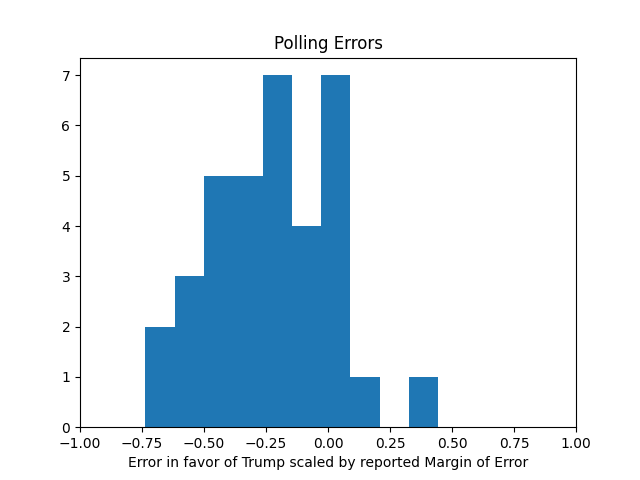
Here you can see each of the polls is well within their reported margin of error. That’s good right? Well, maybe too good. Remember, the margin of error is supposed to be the 95% confidence level. So you would expect 1 out of 20 to be off by more than that. Which indicates there may be some herding going on here, where the polls are manipulated to get a result closer to what is expected. Which may be why there is a clear bias.
In the end, each of these polls put each of these states well within the margin of error. Meaning as far as the polls were concerned, the race was a tossup. So no one should have been surprised by any result.
This may not be all that satisfying to people. After all, if polls can have margins of errors as high as 4.9%, it’s not going to show a clear lead unless one candidate gets a nearly double digit lead, which simply is not going to happen in a swing state. So while that Susquehanna poll did end up coming in within its margin of error, that margin of error meant it was pretty useless as a poll. It had a sample size of 400 voters, which simply is not enough to learn how the race is going in a state as big as Michigan.
Finally, what about that Iowa poll? It showed Harris up by 3 points in a state he won 13 points. It had a margin or error of 3.4 points, putting it well outside. But remember, some polls should be outside the margin of error. This one was outside by quite a lot, but it was clearly an outlier. The very next day another poll came out with Trump up by 9. Anyone who reported on that poll without acknowledging that fact was misleading you.
For the details of this analysis you can look at my code here in case you want to dispute anything.
One thought on “Polling Retrospective”